
First, let’s discuss some common causes of data deviations:
- The tracking code is not present on all pages of the site. This typically occurs on very large sites, or those with complex architecture.
- Incorrect application of data filters. The most basic could be, for example, not excluding internal IP addresses.
- Inadequate identification of referrals, including self-referrals, spam bots, etc.
- Different criteria for conversion assignment, for example, when the attribution model we choose in one tool does not match the one defined in another platform.
- User rejection of 3rd party cookies. According to Webtrends, between 12% and 18% of users block them.
- Misinterpretation errors. Given the immense number of metrics available on each platform, if we don’t understand the real meaning of our metrics, the collection method, and the business context in which they should be analyzed, supposed inconsistencies may arise. If we add to this the fact that various analytics providers may define apparently identical metrics in vastly different ways, or give a variety of names to similar reports covering things like visits, visitors, unique visitors, and conversions. This inevitably leads to misunderstanding.
- Traffic sampling.
- Adblocks. These are on the rise due to the increasing level of advertising saturation users are experiencing.
- Insufficient campaign tagging.
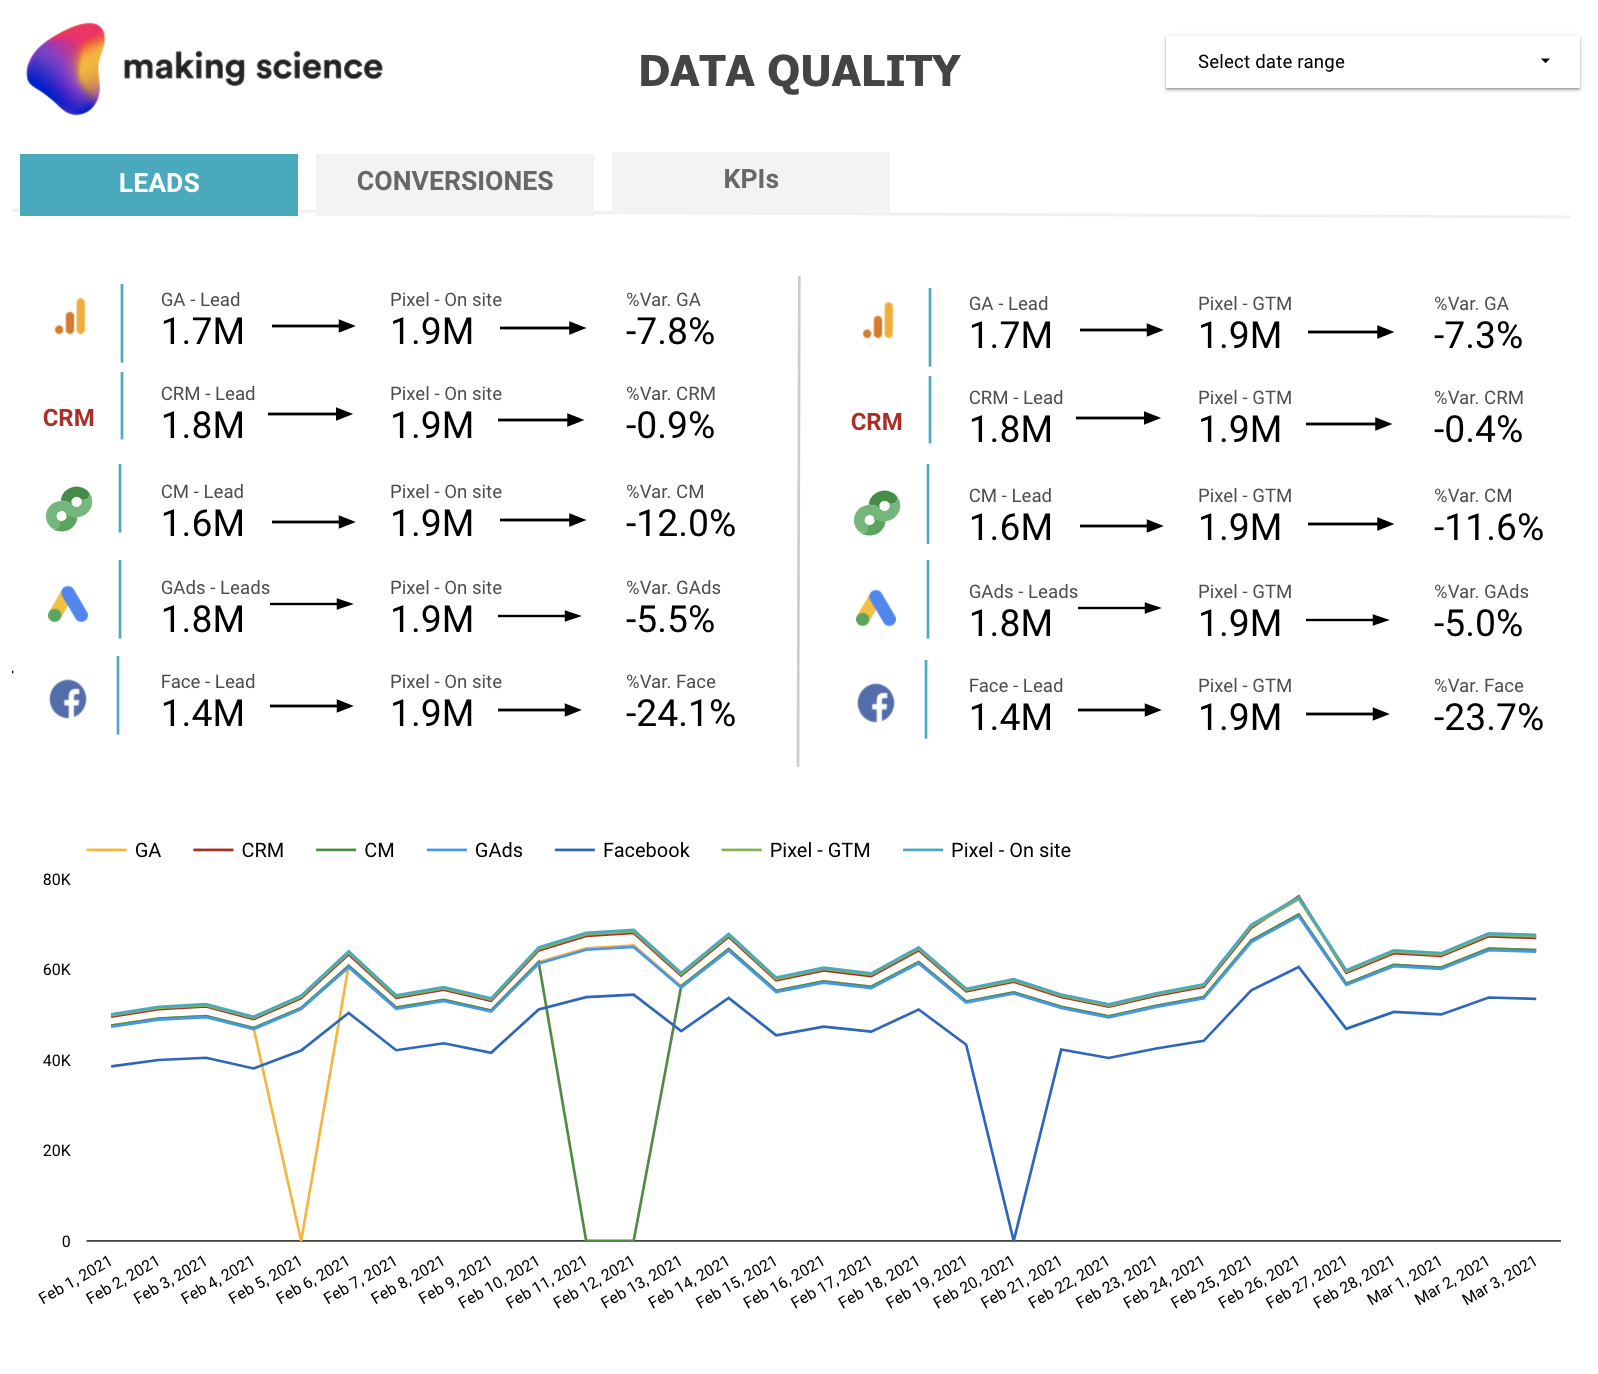
At Making Science, we have developed an AI Solution called Data Quality. This tool swiftly identifies and resolves data discrepancies between measurement and advertising platforms, detects possible trend changes, and analyzes the influence of changes on the web.
How Data Quality Works
The general operation would be as follows:
- We select the measurement and advertising platforms that we want to include in the comparison as well as the key indicators to monitor. The system allows contrasting information from any platform that can export data to BigQuery.
- Simply implement the Making Science Data Quality pixel on your website and in the Tag Manager. This enables the monitoring of the tracking and measurement of any event, interaction, or conversion of interest.
- All information will be analyzed in BigQuery. When there is a significant discrepancy between the parameters, the system will generate an email alert to help you take corrective measures. We will have an automated dashboard in Data Studio to have complete visibility of all the key KPIs of our business.
 Defining the right oversight processes and implementing strategies for complete transparency of primary business parameters across various measurement platforms allows us to track the performance of our assets comprehensively and avert potential issues. Our continuous goal is to optimize investment and make prompt, effective decisions to reduce these discrepancies. This is best achieved by monitoring the progression of crucial business metrics. Solutions like ours, which generate automatic alerts upon detecting specific trend shifts, are indispensable for any analyst or business manager’s daily operations. For further details about the Data Quality Solution, please feel free to reach out to Making Science and consult with our team of experts.


 Cookie configuration