Numerous organizations, ranging from large corporations to small enterprises, are embarking on the transition from Universal Analytics (UA) to Google Analytics 4 (GA4) for their reporting needs. Whenever the topic of migrating or transitioning within an analytics platform arises, you might find yourself pondering several questions such as:
- What are the key similarities and differences between these platforms?
- Why are there discrepancies in the data points?
- How can I maintain consistency in reporting metrics during the transition?
- What potential challenges might arise in the new data interpretations?
Unveiling a Seamless Solution with Making Science
Fear not, as Making Science has simplified this transition for many clients. To make this process even smoother, we’ve introduced an automatic feature to assist you.
Now, with just a click on the “submit” button at the end of this page, you can instantly view a side-by-side comparison of your own GA4 and UA data, absolutely free. This feature helps you resolve doubts between the two different platforms, offering a clear picture of the metrics across both platforms.
Guiding Stakeholders through Platform Differences
Making Science has successfully assisted many clients with platform transitions. With GA4, the transition process and aligning your stakeholders have become even smoother.
- Understanding and communicating the differences in the platforms from the start enables you to guide your stakeholders and teams more effectively, ensuring a hassle-free transition. It’s not ideal to only address these nuances after the debut of your GA4 report, only to subsequently highlight issues with the new process.
- For example, the shift in GA4’s approach from capturing pageviews to unique views, which are naturally fewer than in UA, should be communicated promptly to maintain trust. Why? User privacy concerns have led to shifts in regulations prompting Google to update the way it tracks site visitor data.
- Moreover, differences in setup might appear. A developer, for instance, might miss a datalayer glitch until it surfaces during the rollout of a fresh GA4 capability.
Such scenarios can be stressful for teams. However, leveraging dashboards and automation speeds up stakeholder communication, giving analysts peace of mind. At Making Science, our experience with a range of clients provides us with insight into expected variations.
Visually Comparing UA with GA4
Illustrated below is a comparison of key metrics across the two implementations, providing insight into disparities and analyzing trends to gauge whether variations are evolving over time. This serves as our primary level of investigation, aiming to ensure consistency or at least provide reasons for any discrepancies. Discrepancies might stem from differing metric calculation methodologies or implementation-specific complications.
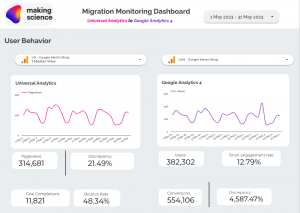
Furthermore, we delve into device categories, pages, events, and channel data to unravel potential sources of discrepancy. Automated reporting frees up your team to delve deeper into the “why”, reducing the time spent on data collection and consolidation for the platform.
![]()
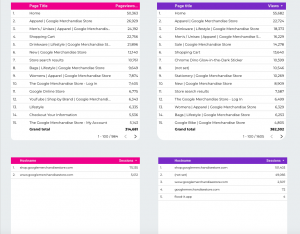
Following industry standards, we recommend a thorough comparison of every metric and dimension, facilitated by automation. Our approach to reporting usually includes custom metrics, dimensions, and events to ensure alignment between platforms. This aspect often improves validation efforts as implementation grows more comprehensive over time.
Conclusion
Embarking on the transition from UA to GA4 can be made significantly less daunting with Making Science. Whether you choose automated reporting through Making Science or opt for an in-house approach, having a foundation of summary metrics will prove beneficial.
Remember, a treasure trove of insights awaits you, and it’s just a click away. Hit the “submit” button at the end of this page to explore a world of data insights, offering a seamless transition experience, entirely free of charge!


 Cookie configuration