
One of the main advantages of Google Data Studio as a reporting tool is its native integration with other Google tools. One of the most widely used integrations is the Google Analytics connector. Data Studio can collect data directly from the platform.
With this integration, we can see and edit reports similar to audiences, acquisition, behavior and conversions, for Universal Analytics or GA4.
We do not have the same luck, however, with the MCF (Multi-Channel Funnels) reports, since these are calculated differently, and are not available from the same API.
Here, we’ll discuss setting up a Multi-Channel Attribution Funnel. Read on to learn more.
Integrating Attribution Reports in Google Data Studio
MCF reports are located under the “Conversions” section of Universal Analytics. They include assisted conversion data, top conversion paths, or path length or time.
These reports can be used to answer questions like
- How many times did search campaigns help in conversions?
- Which channel is most valuable when it is the last interaction?
- How many days/touchpoints does it take for the average customer to convert?
Learn more about multi-channel funnels
Data for channel starters, helpers, and finishers
In the future, we may be able to create them automatically. Until then, to view attribution reports, you can use the following steps.
Note: This integration is exclusively for Universal Analytics properties.
Integration Steps
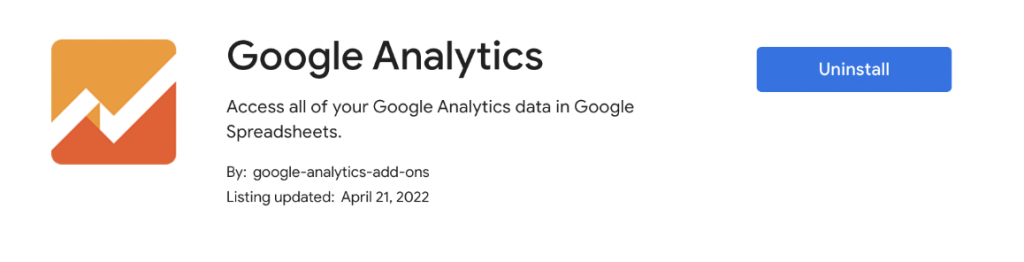
- Install the Google Analytics extension for Google Sheets
This Sheets plugin takes analytics reporting a step further. It offers the capabilities of the Google Analytics API combined with data manipulation in Google spreadsheets.
The API that we will call from here will be the one that will return the data you need. More advanced details of the extension.
- Connect a report through the extension via API
Once the plugin is installed, you will have to launch it from the Extensions menu: in the top bar -> Google Analytics -> Create new report.
Once you do, you’ll need to give the report a name, and select the account, property, and view to apply these settings to.
Leave the rest of the fields empty.
Now you will have a series of fields available, for each of the rows, in which you’ll be able to request information from Analytics.
Start by typing mcf for Report Type, to indicate the Multi-Channel Funnels API.
The minimum fields you will need are:
- Report Name
- View ID
- Start Date
- End Date
- Limit
- Report Type
- Metrics
- Dimensions
You should already have the first 5 ready.
- Choose the appropriate dimensions and metrics and add them to the report
In our custom report, we will need to indicate that the request is to the MCF Reporting API, using the appropriate dimensions and metrics.
To do this, we have to go beyond the ones available in the drop-down list (that’s why we didn’t fill them in before) and look for the ones we’re looking for within all dimensions and metrics available.
Note: These fields, in addition to not being in the drop-down list of the extension, are also not found in the UA dimensions and metrics explorer.
Copy and paste all the searched metrics and dimensions, separated with a comma and without spaces.
Some important dimensions you can use:
- mcf:basicChannelGrouping: Basic channel grouping, automatic from Google Analytics.
- mcf:timeLagInDaysHistogram: Length of conversion paths in number of days. In other words, the days needed to achieve each conversion.
- mcf:pathLengthInInteractionsHistogram: Length of conversion paths in number of interactions. That is, the number of touchpoints needed on each channel to result in a conversion.
- mcf:basicChannelGroupingPath: Sequence of most successful channels along conversion paths.
And some important metrics:
- mcf:totalConversions: Total conversions. Including goal achievements and transactions.
- mcf:totalConversionValue: Total value of conversions. This metric includes goal achievements and transactions.
- mcf:firstInteractionConversions: Number of conversions in which the channel has appeared in the first interaction.
- mcf:lastInteractionConversions: Number of conversions in which this channel has appeared in the last interaction of the conversion. This metric includes goal achievements and transactions.
Launch the report
We can run the reports from the Google Analytics extension menu -> run reports. If all is well, a new tab will be created with the name you have chosen.
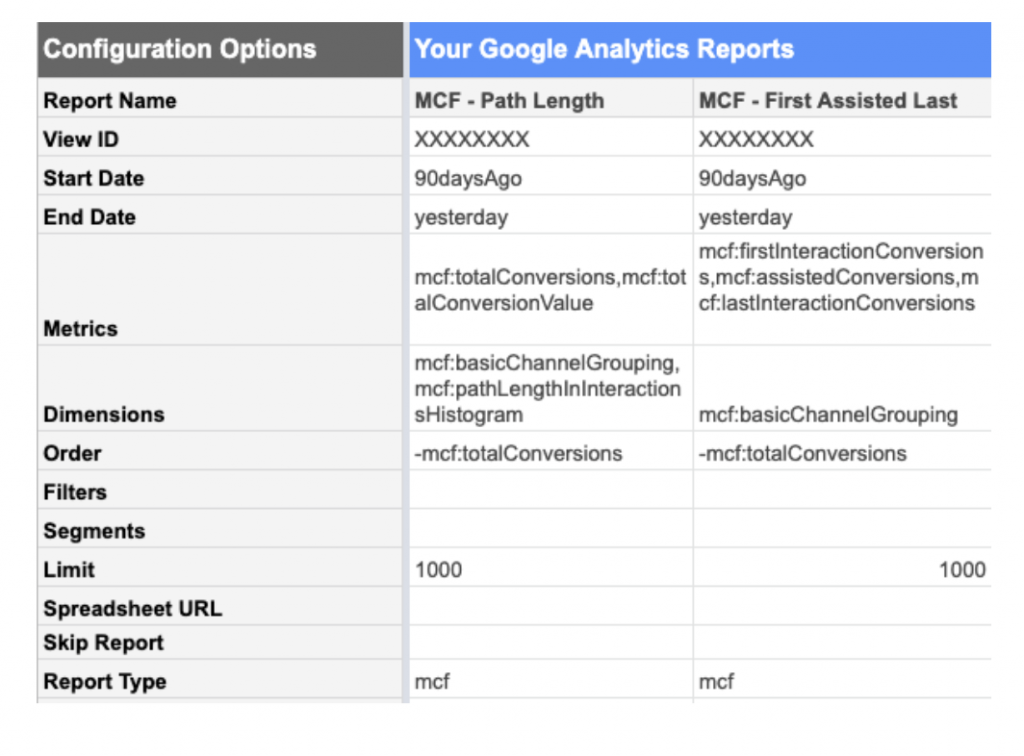
For example, with the following metrics and dimensions we will have the following reports:
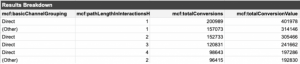
- MCF – Path Length: Example report of the length of touchpoints per channel
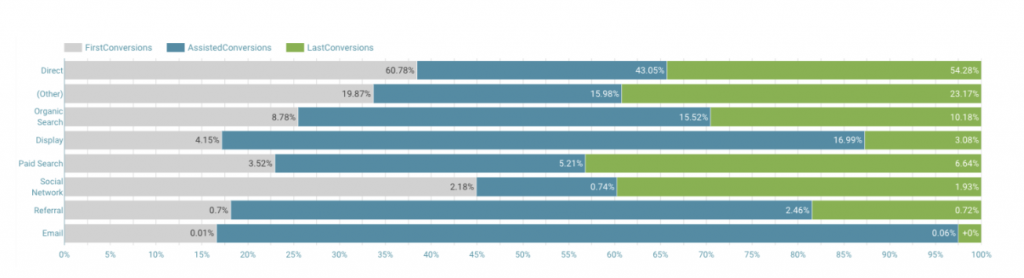
- MCF – First Assisted Last: Example report of the conversions of each channel as initiator, assistant and finisher
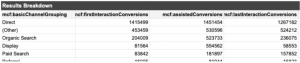
In the first example, we’d see information like this:
And in the second example, we’d see information like this:
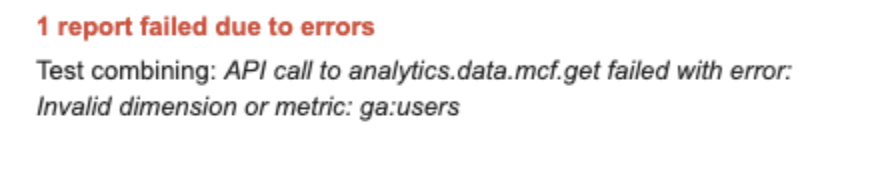
Note: MCF reports can only be run with mcf dimensions and metrics. If we combine these with standard metrics or dimensions, the report will give an error like the following:
Connect the reports with Data Studio
To connect the reports and view the information from Google Data Studio, it is as easy as creating a new report, or opening an existing one, and connecting a data source from Google Sheets.
First, find the report you have created. Then, connect each of the tabs (reports) that you have requested to the Google Analytics API.
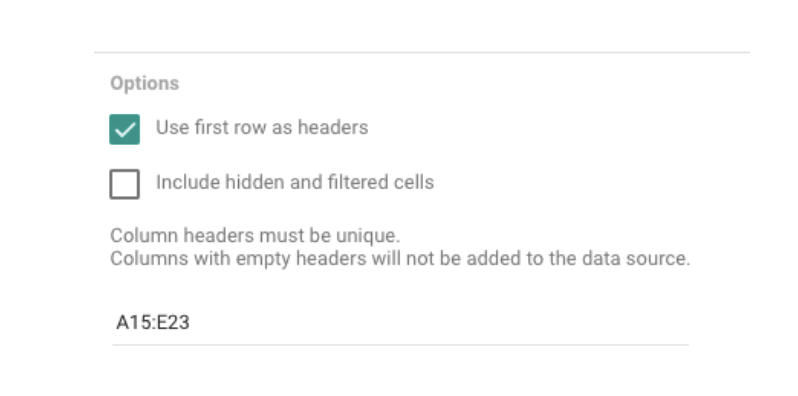
Note: the reports do not appear in the first row, so you must choose a specific range in the options to connect the document and view the information (example: A15:D1015).
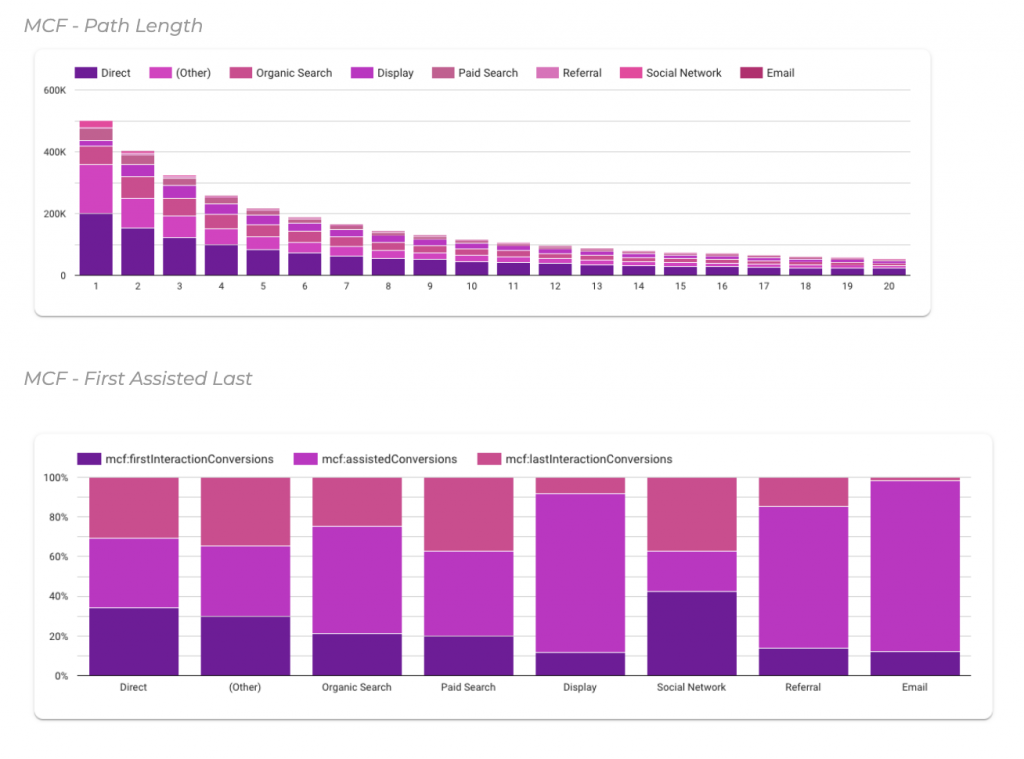
Following the previous examples, these are the visualizations that we could create with the previous information:
Updating and scheduling reports
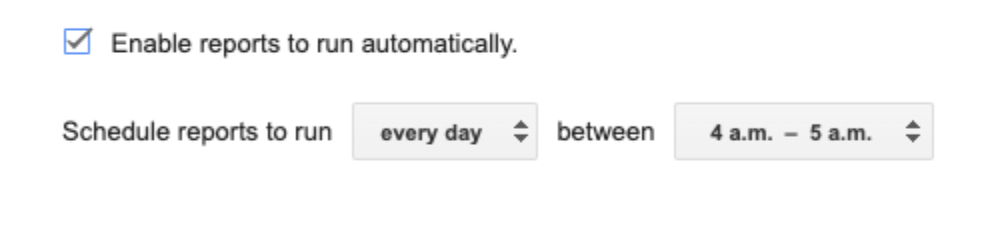
Whenever you want to run the report again, you can do it manually. But the extension also allows you to schedule reports to run automatically, so your data is always up to date.
To do this, just go to the Google Analytics extension menu -> Schedule reports. Here you’ll choose the interval of the execution.
Change existing reports
If we want to edit an existing report (for example, change from the last 30 to 90 days, or add a new metric), we must do it by editing the reports table directly.
Now you know how to connect attribution reports in Data Studio! Enjoy and take advantage of this functionality to get useful information from all your campaigns.
Bookmark these links to finish
Need help getting started?
If you need help implementing reports in Google Data Studio (or, let’s be honest, ANY type of data-based reporting) don’t hesitate to reach out to our team.


 Cookie configuration