

We introduce you to the new generation of Google Analytics: GA4

We introduce you to the new generation of Google Analytics: GA4
We welcome the latest version of Google Analytics! Called Google Analytics 4 , this new type of property (yes, there are no views as we are used to) provides, among other things: much more expanded predictive information, a deeper integration with Google Ads, more measurement capabilities between devices, and more specific data controls. The launch announced on Wednesday, October 14, is actually an expansion and renaming of the well-known App + Web property launched last year, and marks an important first step in the evolution of Universal Analytics.   We are going to analyze some of its improvements:

  • On the one hand, it will provide us with new knowledge and predictions based on artificial intelligence. While knowledge – based machine learning Analytics have been available for some time, new knowledge and predictions that reach Google Analytics 4 can automatically alert the marketers of some trends, such as growing demand of a product. It will also be used to predict results such as churn rates and potential revenue a business could earn from a specific customer segment. All this information can help us anticipate the actions that our clients could take in the future and thus focus on higher value audiences.


  • Improved integration with Google Ads. Now we can generate and maintain audiences of our users on the web and in the application. For example, if a user is qualified for an audience list due to an action performed on the web and was removed from a list because they made an in-app purchase, the list would automatically update to remove the user and not be impacted. with ads. In addition, Google Analytics 4 will report on the actions of the YouTube involved views that occur both in the application and on the web.


  • One of the most notable differences between Analytics 4 and Universal Analytics is the organization of the reports based on the customer lifecycle. These reports will help us delve into specific aspects of the customer journey. For example, we can see which channels are generating new customers in the user acquisition report, and then use the engagement and retention reports to understand the actions these same customers take and whether or not they stay after conversion. The new Analytics experience also aims to offer us a more complete view of how customers interact with your business across devices and channels. We can also provide your own user ID or enable Google signals to deduplicate users across devices, both in reporting and ad targeting.


  • Another benefit is event tracking without code implementation. This makes it easier for us to monitor and measure the actions that are important on the site and in the app, and also in real time (in Universal Analytics, events usually arrive with some latency). For example, we can measure a scroll event or the playback of a video, without having to add code or configure event tracking in GTM.


  • We are also going to have a more specific user data control. Analytics 4 also includes options to help advertisers comply with data regulations like GDPR and CCPA. The consent mode is designed for sites that must have end-user consent to collect analytics data, and this new mode provides us with separate consent options for analytics and for ads. Data deletion options have also been improved, allowing companies to fulfill user deletion requests without having to delete more data than is necessary. In addition, it includes a preview mode so that companies can verify the data they are about to delete.


  • How will it affect our analytics in the future without cookies? Well, as third-party cookies are removed , Google already anticipates that data scarcity will become the new norm. It will rely on machine learning to repopulate data gaps.

  In conclusion, the new property of Google Analytics 4 provides a more complete cross-channel view of the customer life cycle and uses that information with predictive marketing functions, providing us with more information, and more efficient ways to act based on those discoveries. Our recommendation is that when you have to configure a new property, do so with this new version. The previous one, Universal Analytics, will continue to be available but we recommend activating GA4, since it will be the focus of improvements and news within Google, and keep both measurements in parallel. From Making Science we can help you get it started! You dare? Ask for information at info@makingscience.com.
Google Analytics Web + App: Data Revolution

Google Analytics Web + App: Data Revolution
If you work in a Data department and you have read the title of this article, surely a little tickle has gone through your body and thousands of possibilities go through your head in these moments. Well indeed, this functionality has just landed in our little great digital world to try to offer a joint vision of the multiplatform world .

What is Google Analytics: Web + App?

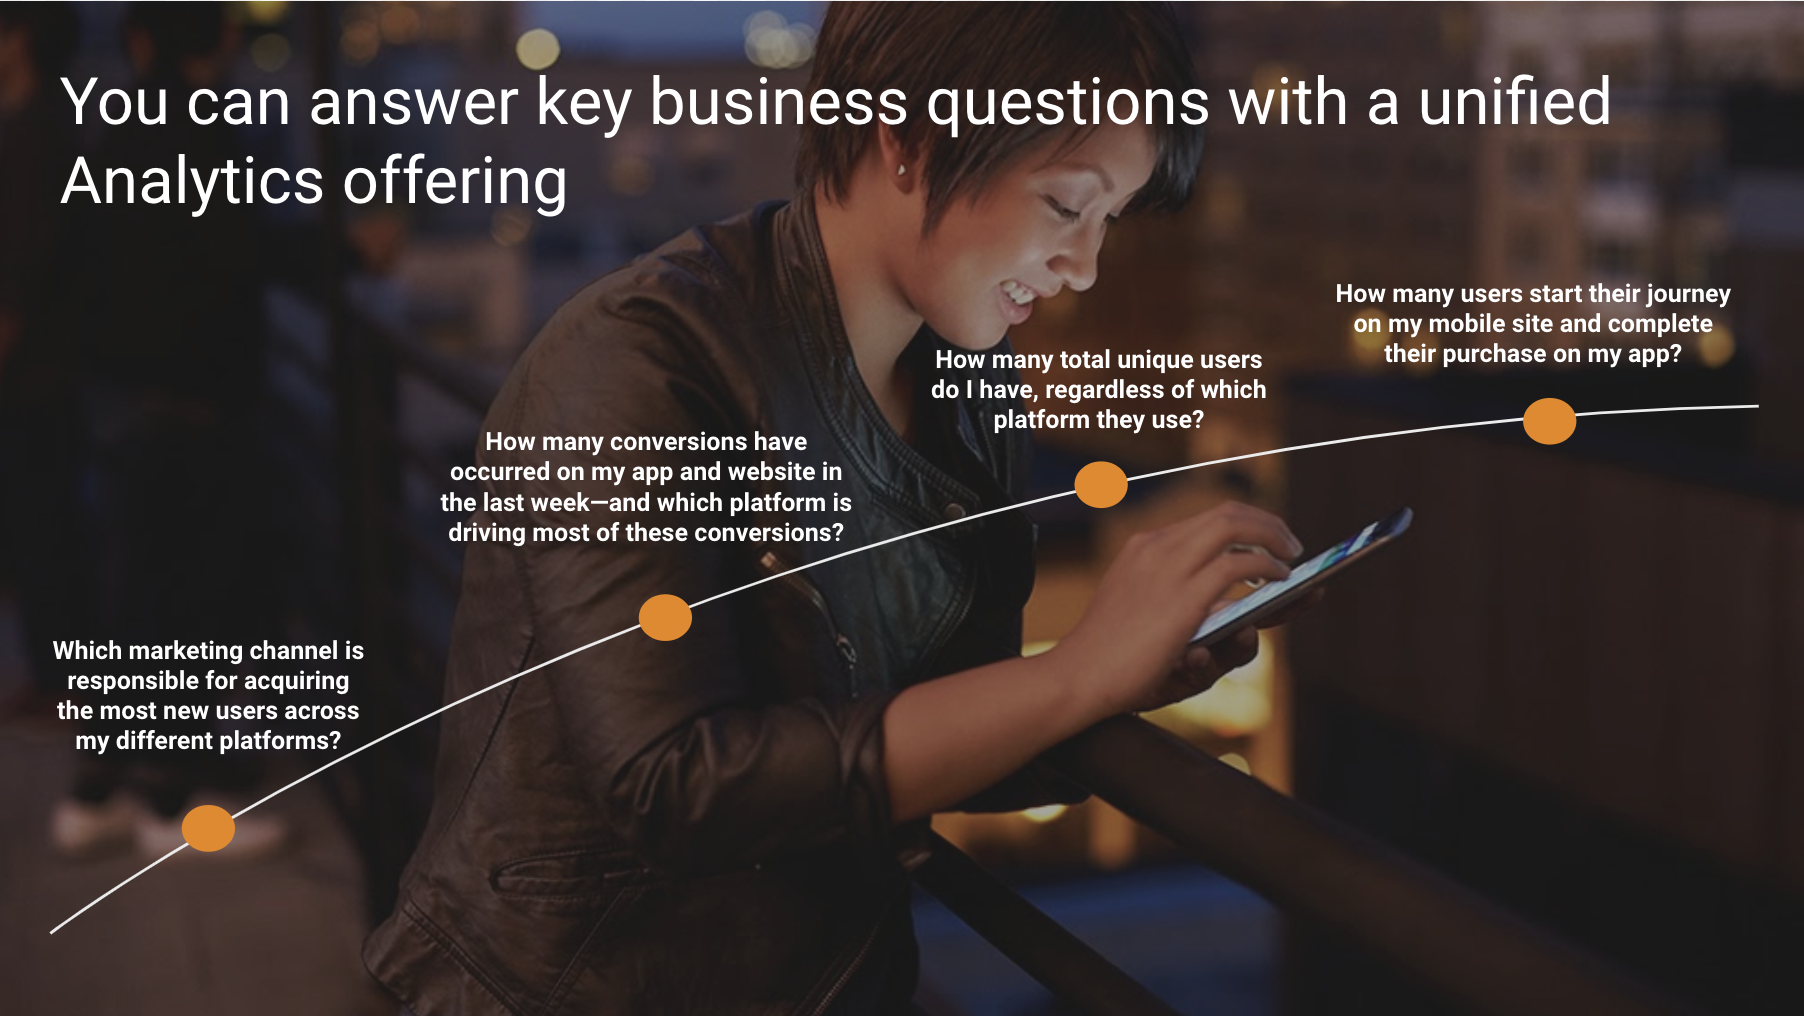
Well, as its name indicates, it is a property that allows us to have a joint view of users and their behavior through the web and the app in a single report. At the moment it is in its initial phase and, therefore, in the full learning and optimization curve. And what are the main advantages that it will offer us? There is a world of possibilities, but if we must highlight some, they would be these two:

  • Cross platform measurement

Unified and consistent reports of the web and app to have a global and unique view of the data.  

  • More complete Customer Journey

Finally, we will be able to know in more detail the path followed by that high percentage of users who start their navigation in the app and end it on the web and vice versa.  

Limitations and points for improvement

I am sorry to reduce the euphoria to those of you who have reached this point in the article, but like all new functionality that is in Beta phase it has many limitations, and therefore, a lot of room for improvement. Here are some of the most important:

  • Impossibility of integration with DV360, SA360, BigQuery, etc.

Currently there is no possibility of integrating it with other tools in the Google Marketing Platform world, but we know that it is on its Road Map for 2020.  

  • E-commerce (App + Web)

It is one of the features that we miss the most in this new property, since right now we do not have any visibility of this type of reports.  

  • Limited Attribution Reports

This section is currently quite limited (if not null) and is one of the main points of improvement that they have planned for 2020.   And it is that, this functionality has yet to grow and mature to exploit all its possibilities, and if Google puts the love that we anticipate, added to the undoubted potential of this new feature, we may be talking about a revolution in the world of digital analytics.  So we have to be patient and, although in the Data world we are used to constant evolution and progress without time to settle, we are going to be forced to wait for updates. And as the saying goes, we don’t want to run before we learn to walk. What is certain is that it opens a new path full of possibilities that will allow the Data departments of any company a deeper knowledge of the behavior of its users and customers in order to adapt more efficiently to their needs.

If you work in a Data department and you have read the title of this article, surely a little tickle has gone through your body and thousands of possibilities go through your head in these moments. Well indeed, this functionality has just landed in our little great digital world to try to offer a joint vision of the multiplatform world.

What is Google Analytics: Web + App?

Well, as its name indicates, it is a property that allows us to have a joint view of users and their behavior through the web and the app in a single report. At the moment it is in its initial phase and, therefore, in the full learning and optimization curve. And what are the main advantages that it will offer us? There is a world of possibilities, but if we must highlight some, they would be these two:

  • Cross platform measurement

Unified and consistent reports of the web and app to have a global and unique view of the data.  

  • More complete Customer Journey

Finally, we will be able to know in more detail the path followed by that high percentage of users who start their navigation in the app and end it on the web and vice versa.  

Limitations and points for improvement

I am sorry to reduce the euphoria to those of you who have reached this point in the article, but like all new functionality that is in Beta phase it has many limitations, and therefore, a lot of room for improvement. Here are some of the most important:

  • Impossibility of integration with DV360, SA360, BigQuery, etc.

Currently there is no possibility of integrating it with other tools in the Google Marketing Platform world, but we know that it is on its Road Map for 2020.  

  • E-commerce (App + Web)

It is one of the features that we miss the most in this new property, since right now we do not have any visibility of this type of reports.  

  • Limited Attribution Reports

This section is currently quite limited (if not null) and is one of the main points of improvement that they have planned for 2020.   And it is that, this functionality has yet to grow and mature to exploit all its possibilities, and if Google puts the love that we anticipate, added to the undoubted potential of this new feature, we may be talking about a revolution in the world of digital analytics.  So we have to be patient and, although in the Data world we are used to constant evolution and progress without time to settle, we are going to be forced to wait for updates. And as the saying goes, we don’t want to run before we learn to walk. What is certain is that it opens a new path full of possibilities that will allow the Data departments of any company a deeper knowledge of the behavior of its users and customers in order to adapt more efficiently to their needs.

The future of cookies

The future of cookies
Who has not considered what will happen to the digital ecosystem as a result of the so-called news of the blocking of third-party cookies in browsers? A few days ago, a Google Attribution, Measurement and Omnichannel specialist, commented the following about the digital environment and the treatment of audiences: “We have lived in the Wild West”. We can not agree more. That is why we understand that the digital market, and with it the treatment of user information, is undergoing so many changes. First of all, it is essential to know the difference between own and third-party cookies. The 1st party cookies are those collected directly by the main server and the 3rd party cookies that are collected in the publisher’s landing but are sent to third-party servers, such as Campaign Manager or Facebook. Once the difference between the two is understood, the epicenter of the problem arises when Google communicates that in 2022 it will block third-party cookies in its Chrome browser. The industry, directly and indirectly, is urgently demanding a change in the digital market and with it in the treatment of data. This demand translates into three main premises :

  1. Users: the user has stated that they do not want us to control them and that is why they browse incognito or even take time to download Ad Blockers.
  2. Regulation: increasingly restrictive consent laws such as GDPR, ePrivacy Directive, CCPA, IAB transparency & Consent Framework, ECJ Planet49 case, National DPAs announcements. Increasingly strict regulations on the treatment of user data and with it, the collection of cookies.
  3. Technology: as we know, ITP (Safari) and ETP (Firefox) by default block third-party cookies and as we have commented previously, Chrome adds to this construction of a more private web environment.


Why should we care? How is it going to affect us?

This new digital ecosystem is going to require an adaptation process because it will mean a change in the way we measure the data of our business and of each client. In addition, certain functionalities of our technologies will be altered.

  1. Audiences: The collection of audiences such as tag-based audiences (Campaign Manager floodlight), frequency cap and DMP audiences will be affected. This will increase the importance of the 1st party data that each client has stored in addition to its activation.
  2. The personalization of the content of the ads will also be affected.
  3. Increase the pressure on the measurement, reporting and attribution of conversions. Reports such as the identification of unique users and overlap will be limited.
  4. The optimization strategies such as CPA or bid to maximize conversions will also be affected by lower volume cookies will experience platforms.


Today’s solutions

We must take into account this new digital context with limited cookies and begin to delve into possible qualified solutions that we already have at our disposal. The Google Marketing Platform ecosystem offers us extensive advanced solutions that we are also already exploiting today.

  1. Google audiences like Affinity and In Market: Google will continue to have a broad reach of users based on their affinities and purchasing interests.
  2. Programmatic Deals through Display & Video 360: with guaranteed programmatic agreements and other types of deals such as Preferred and Private, we can reach our target audience, thanks to the segmentations offered by the different media.
  3. Offline conversions: the GMP ecosystem allows us to import offline conversions, so this solution would allow us to obtain greater visibility on the platform of our user’s behavior and make more beneficial decisions.
  4. Customer Match: creation of audiences based on the uploading of databases of our users to platforms such as Display & Video 360 and Google Ads.
  5. Ads Data Hub:  A tool that allows you to send 1st party data to BigQuery and analyze it against the campaign data. One of the objectives of this tool is to create highly qualified audiences but in groups of at least 50 users, in order to maintain the qualification of the data without losing the user’s privacy.
  6. Server to Server: in this case a server, such as the Tag Manager Server, directly receives the information from the DataLayer from the web, stores and processes this information in order to subsequently send it to Google Analytics.
  7. Finally, the disappearance of the 3rd party cookies will not affect all contexts. Neither mobile nor Smart TV will be affected, so we also recommend exploiting these other types of environments that are also booming in the current digital ecosystem.

We are aware that this new ecosystem still has many unknowns and therefore we recommend taking time to establish a solid strategy based on it. Google is said to start testing in 2020, so we have time to catch up!

New Google Tag Manager Server Side

New Google Tag Manager Server Side
Due to the evolution of the privacy laws (GDPR, CCPA,…) and the restrictions on cookies by browsers, we have been wondering for a long time how long our measurement systems will be optimal. This has caused the need to create and develop new technologies and for us to rethink the way we store, send and use the information we have about users. Last week Google released the great news that its new GTM tool, Server-Side Tagging, was finally going to be a free and public tool for all customers. And this is why we want to tell you why we think you should start making use of it as soon as possible. At Making Science we have been implementing this product in some advanced clients since the beginning of the year. Until July we have not opted for a migration from the client side to server side version, but for a dual implementation of both containers. However, with the product news of recent weeks, we are already beginning to have customers interested in migrating to server-side as the main data collection system for digital analytics. The first thing we have to be clear about is what this new product consists of and how it works. For this we have to think differently and forget about the logic that we have used so far, since the operation of the container and what we are going to find within it, vary with respect to the traditional Google Tag Manager system.  The Server-Side Tagging takes the concepts of Google Tag Manager to the server world. Our own server that will allow us to store, mold and send the data that comes to us as information from us and not from third parties. This system will allow clients to run a Tag Manager container in the cloud (for now only through Google Cloud Platform), advertisers will be able to send data from any of their sources (websites, applications, devices, etc.), and the server container will shape and guide the data to the proper destinations. One of the strengths of Server-Side Tagging is that it allows you to control how your visitor data is collected and modified for multiple endpoints. We are going to analyze some of its strengths below:

  • Improved End User Experience. Fewer scripts on the page that increase performance and loading speed, which indirectly leads to better conversion. Moving the scripts out of the browser means that visitors have to download and run less code.
  • Better Security. Tags can gain access to all private user information on web pages. Fewer third-party tags are running on the page reduces the risk of data leakage.
  • Visitor IDs Managed by The Server. Tags can store visitor IDs on the server rather than in the browser, allowing us robust ad measurement with a high degree of data control.
  • Easy to Obtain. From now on we will have in the GTM platform itself the option to create a container type “Server” that will be configured in four simple steps.
  • Optimized Data Flow. You can get information and control what data is sent and where. You have the option of sending data to multiple destinations without a multitude of labels.

It is true that being a beta product we can find small handicaps such as, for example:

  • The tag templates that client side tagging is accustomed to are not yet available except for Google Analytics, and that means that we have to wait a little time to be able to use them, or develop them ourselves if necessary.  
  • For example, that you have to have the Google Cloud Platform service, which may carry some small costs depending on the use.

Despite these handicaps, due to our application experience in various clients, we advise to start using it as soon as possible (without forgetting the measurement we currently have), so that both methodologies coexist so that we can see, analyze and learn what we provides Server-Side Tagging as opposed to Client-Side Tagging. And above all, be prepared for what looks like the future of the now famous cookieless world. Now, if we already have a measurement system, how do we know if this investment in time and costs really compensates us? Well, basically, as Darwin said: “It is not the strongest species that survives, nor is it the most intelligent that survives. It is the one that best adapts to change”.  The digital world we know is constantly changing, and the cookieless world is something already present to which we must adapt as soon as possible if we do not want to be left behind. Server-Side Tagging will be necessary for:

  • Improved site performance on 3rd party cookie tags . Slow page speed has been correlated with higher bounce rate. Studies show that e-commerce sites see a substantial improvement in revenue when they improve site performance . Site performance is also a factor in search ranking .
  • Control over the security of 3rd party cookie tags . Server-side labeling reduces the risk of data leakage and scraping of private user information. Data leakage can carry high financial penalties.
  • Own internal MTA / 3rd party custom cookie solution . Ensures optimal performance of Google tags, which are used to rate media performance, recommending Google’s server-based tagging solution.

  We hope this article helps you better understand this new system and helps you make the right decision. Do you dare to implement it? If you need help to carry it out, do not hesitate to count on us! You can request information at info@makingscience.com.

How UNICEF is improving its donation results through a User Experience strategy

How UNICEF is improving its donation results through a User Experience strategy
In the marketing actions of NGOs and solidarity associations, understanding user behaviour is essential, which is why data measurement plays such an important role. UNICEF’s Spanish Committee decided to improve user experience by developing the online metrics of its website, through practices such as the A / B Test, which facilitated the optimisation of the donation funnel and improved results.   The objectives

  • Measure user behaviour on the website
  • Maximise the benefits derived from the application of Google Analytics
  • Increase the conversion rate via improvement of the website user experience.

Focus

  • Google Tag Manager configuration
  • Different A / B tests were developed based on the results of the data analysis.

The results

  • +86.3% Conversion Rate improvement
  • +47.40% Revenue improvement

As a starting point for this process, UNICEF’s Spanish Committee decided to hire the services of an agency specialised in data measurement and user experience (in this case, Making Science): This agency remains involved in the ongoing, continuous optimisation on the website in question.


The objective

The objective that UNICEF Spanish Committee pursued was to obtain data and analysis, through Google Analytics, to support decision-making with respect to improving the user experience. This data collection was focused on improving the donation funnel and avoiding the abandonment of its users; in order to reduce the rebound rate of the funnel and increase conversions and hence revenue.  

Focus

The first thing that UNICEF’s Spanish Committee needed to do in order to optimise the user experience on its website, was to achieve a more correct initial configuration of its metrics. Thereafter these were analysed to identify priorities for further optimisation. To carry out improvement actions on the site, collection of all data was necessary. To facilitate the process, Google Tag Manager was used; a labelling tool that facilities tag creation without the need for programming. Thanks to this tool, Google Analytics, testing tools and other tools have been implemented in a very simple way. The main measurement tool that has been used is Google Analytics with advanced implementations in order to have as much information as possible. In order to understand more in depth, the behaviour of the users and complement the information of Google Analytics, other user recording tools were used that enable going into detail and identifying weak points. Thanks to these tools, the agency has been able to collect information such as: name of each form, calls to action clicked, donation amounts, from where they have arrived, at what step of the form users abandon, etc. Through this data collection, UNICEF obtained all the information it needed to carry out the analysis of its web: identify weaknesses and propose the necessary improvements.  

The results

Together with other user recording tools, a number of problems were identified on some pages, and with this data, Making Science carried out different tests, so that only those mesas that would clearly improve the conversion rate are implemented. Most tests are performed using the A / B approach. That is, 2 options (original and variation) are shown alternately to the visitors that access that page, presenting each option to 50% of the visits. A practical case is that of the donation funnel through the mobile. One of the weaknesses of the UNICEF Spanish Committee’s website, is that this form was giving bad results, since in the recordings of this funnel they showed that a large number of users left the page in the first step. With this data, applying the user experience knowledge of the agency, and based on the results of the tests it was decided to modify and reduce the funnel from 4 steps to 2, to see if this improved the percentage of user abandonment.

  • Form: Partner – General Form. A / B Test: Reduction of 4 to 2 steps of the donation funnel
  • + 86.3% Conversion Rate Improvement
  • + 47.40% Revenue Improvement


The conclusions

The union of data analysis and usability improvements helps us identify problems to make improvements through tests and thus optimize the site.

This case shows that it is worth dedicating resources to a constant optimization of the user experience based on data analysis and A / B tests. In short, the growth of a project always goes hand in hand with a constant improvement of the user experience.

Content grouping: What are they? What are they for? and how are they configured?

Content grouping: What are they? What are they for? and how are they configured?
As digital analysts each day we face different types of sites composed of many pages of content, where the analysis can become very complex. Without too much complication we are able to understand the performance of the pages that our site contains, but what if we want to go a step deeper? Through the grouping of content or content grouping we will give an exponential leap in our analysis, having a more strategic vision about our products or services presented on the web site. A grouping of content is an option in Google Analytics that allows us to compare different metrics for similar contents of our website. In this way, we will group the contents in a logical way according to the structure of our site, being able to be used as a main dimension and obtaining more powerful analysis. Google Analytics gives us the option of creating a maximum of 5 content groupings and they are valid from the date of creation, that is, the data can not be viewed retroactively. Content groupings are made at the view level. For this we will go to Manage / View / Content Grouping. Below, we detail the three ways to make a content grouping.

  • Grouping by definition of rules:

This is the simplest option, but at the same time more laborious and manual. It consists of creating rules to assign content. First we will choose the dimension (Name on screen, Page and Title of the page) and then the matching option. For example: Page> contains> / pants /

  • Grouping by extraction: This option will allow us to extract pages through the dimensions Name on screen, Page and Title of the page using a regular expression. It will consist of detecting a common part and a differentiator within our dimensions to form a pattern.

For example: using the Page dimension / men / shirts / / men / pants / / men / shirts / /mens/(.*?)/ (. *?) It is the differentiating part that we are going to extract to classify our content.  

The most important thing about this step is to set the correct index number (in example 1 the index number is set) and to configure the same index number in GTM(Google Tag Manager). This is the only thing that should be done in this step. At this time we have to quote the dataLayer, since it will be through this layer where we will declare the variables to be collected. In the following link you will learn more about what a dataLayer is. The rest of the steps will be executed in Google Tag Manager. We will create variables (of variable type of data layer) that will collect the values ​​(static or dynamic) of all our pages thanks to the dataLayer. Once the variables are created in GTM, the next step will be to associate them with a Google Analytics tag. Within the option of Content Groups, we will put the same index that we put in Google Analytics. In the previous example, two variables have been created (template and category_name) that will be used as a content group (indexes 1 and 2). With this, the entire Google Tag Manager configuration would already be present. Now, from Google Analytics we can use these groupings of content as primary and secondary dimensions. We can see them in the Behavior / Content / All Pages report as a primary dimension if we display “Content Grouping”.
  • Grouping by tracking code:

This way of grouping the content can be done using Google Tag Manager, in this way we avoid inserting it directly into code. The first thing we will have to do is enable the tracking code in Google Analytics:

Other reports where we can also see the content groupings will be in: Behavior / Content / Pages of destination and in Behavior / Flow of behavior. In the same way, and as a secondary dimension, we can use these content groupings in the Acquisition reports. There are no longer excuses to prevent us from focusing on those data that truly interest us.

What is a dataLayer?

What is a dataLayer?
The data layer is the website layer where data is stored per page view (hit, user, session and product) and we can use the data layer to carry out actions that improve the performance of our website. What types of variables can we collect in our dataLayer? • Static: The way in which the data is stored is done statically, that is, the values ​​that the dataLayer collects are always fixed. Example, the versioning value of the dataLayer that will always be the same for the life of a given version of the website. • Dynamic: This is the most typical attribute type, it consists in saving the data inside the dataLayer for data attributes that are changing. For example, we could use the same dataLayer for all our products, but each attribute/variable’s value will be dynamic depending on the product we are seeing. What benefits can we perceive using the dataLayer? The information we get from the dataLayer provides us with more information about the behavior of users on our website. Therefore, we will have more possibilities to control and act on our business strategy by understanding what our user does from their first website visit with us until their conversion. Some of the benefits that we can obtain with the implementation of the dataLayer are:

  • Content grouping: The use of dataLayer allows us to have a standard system to expose data, making it easier to detect changes. * In addition, conversion funnels can be configured.
  • Electronic commerce: The most reliable and safe way to measure conversions is through the variables of electronic commerce (transactionId and transactionTotal). Since for example, when using the dataLayer they are less subject to errors in case the web is modified.
  • Audiences: By collecting more valuable information through the dataLayer, we can make a more powerful audience list that helps improve the conversion rate of our campaigns.
  • Facility for the creation of activation rules in the pixels. Since, a label can also be triggered based on the information that appears in our data layer.

What variables could be collected in the dataLayer depending on the business model? Travel sector: Some of the variables that could be collected would be: o Know the number of nights that the user has selected. o Number of people who have acquired the service. o Origin of the user from which you are going to make your trip. o Destination chosen in the conversion. o Time in advance with which they have purchased the service. Retail sector: Some of the variables that could be collected would be: o The product discount. o The number of opinions that a particular article had. o Number of photos of a product in the product file. o Whether the product was offered or not. o Know the number of previous purchases of a user. Automotive sector: Some of the variables that could be collected would be: o Vehicle engine: 135cv, 150cv … o Vehicle color: blue, red, green … o Car fuel: diesel or gasoline. o Name of the concessionaire: Getafe, Barcelona … o Type of car: new car, semi new car or used car. In short, it is very important to define a good measurement strategy to be able to extract more information from our website visitors that helps us to make decisions within a company.    

How to overcome the challenges in becoming a Data Driven Company

How to overcome the challenges in becoming a Data Driven Company
Technical difficulties are not usually the main problem in digital transformation to become a Data Driven organization. The majority of technical problems that we encountered a few years ago; Big Data, Machine Learning, advanced data attribution, systems customization or automation, are solved at a technical level. However, in some cases digital transformation projects fail. The real barrier appears in most cases to be in the resistance to change the organization itself. When implementing the different initiatives and projects it is important to take into account the main risks and above all the difficulties in many occasions in purely embedding and rolling out the changes  into our day to day work activities. I do not intend to list them all, but from my point of view and based on the experience of different projects in which I have participated, I would like to point out the following: – The great complexity and diversity of the technological environment. Just by observing one of the latest marketing technology landscape, its great number and difficulty is clear. – Internal barriers and in many cases the cultural clash itself within the organization between who does what and who will do what in the data driven organization. – Although  improvements may be observed, in many cases we are still a fragmented organization operating in silos and not fully reaping the benefits of a true data driven company. – New GDPR data protection regulation, which raises the level of protection and security in terms of data and yet new challenges. – And finally, technical limitations, such as increasing the number and type of devices. As professionals who are dedicated to this, we must not fall into discouragement to find the many disadvantages and especially not see these difficulties as problems but only as circumstances to go through to become a Data Driven company.
To achieve success and a digital transformation project that does not become a journey through the desert, I recommend considering the following aspects: 1. Begin with a strategy A correct initial analysis that includes knowing the initial starting situation of the organization with respect to all involved Stakeholders, will be essential to be able to correctly plan each of the strategies and phases of the transformation project, thus achieving the commitment of the different stakeholders. 2. Truly understand your business I would like to focus this aspect on how the different interactions an organization has with its consumers affect the results in the short, medium or long term. We talk about our initial communications even before our future customer knows who we are,  even the actions of loyalty program, how do we interact in cross-selling and up-selling, without forgetting the interactions during incident management or possible other problems during our relationship with the consumer. 3. Accept that a perfect attribution is impossible   Just when we begin to understand a little better how the data works and how are the different interactions with the customer through the customer journey, we tend to fall into the error of looking for the accuracy and perfection of the system. Although the quality of the data and its veracity are paramount, establishing a perfect attribution as an objective, even if it is only applied to marketing, is a wrong approach. It is important to focus and focus on arranging an actionable attribution. 4. Need to change and learn to manage change The real barrier is found in the resistance to change and even in the blockade that in many cases we observe in the very structure of organizations that are immersed in processes of digital transformation. Without correct change management we considerably increase the risk of failure and above all, we will make the process much harder for the different parties. 5. Always put the initiative at the center of the consumer strategy Sometimes we focus more on the products or channels than on the consumers themselves and unfortunately the intensification in the use of different devices (mobile, tablet, desktop) and the new ones to come (voice, IOT …) are complicating the vision every day to be consumer centric and while in most cases only biased parts of reality. Remember the phrase We must be Data Driven to be Consumer Centric. Being data-driven managed  means to become a truly an organization focused on its customers and not the ultimate goal of being a Data Driven managed Company. 6. Embrace and Align even more around Data and Technology As our CEO José Antonio Martínez Aguilar points out, As our CEO José Antonio Martínez Aguilar points out, only with technology are you able to beat the technology  and from the Making Science Group we are very optimistic about doing exactly that for our customers. The new algorithms of Machine Learning and Artificial Intelligence that we are beginning to obtain carry some of the traditional difficulties of Online Marketing at an unimaginable scale and many of the processes that previously required the participation and collaboration of different highly specialized technical teams, as well as months for its correct functioning can be more efficiently automated, greatly facilitating the adoption of this new technology by companies while just a few years ago this advanced technology was available only to large governments.  

What do you expect from Big Data in 2018?

What do you expect from Big Data in 2018?
In a significantly short period of time, big data has evolved from being a topic usually discussed in meetings and conferences of science experts, to play a very important role in almost any industry. The ability to process and extract large volumes of data to offer new insights has radically altered the dynamics of companies and their way of doing business, boosting sales and attracting customers, thus becoming an essential component of business strategy today. Seeing that companies have tried to find new discoveries and opportunities locked in big data, we foresee the following trends for the world of analytics in 2018:

1. Knowledge-oriented companies Progressing:

Understanding, managing and manipulating large volumes of data has become something ubiquitous and that most companies have the ability to deal with. 2018 will be the year in which successful companies will move beyond the simple manipulation of data, to take advantage of the ideas that big data can reveal. The focus will be on carrying out effective data mining to meet the requirements of the organization and for the accurate orientation of products and services. A knowledge-oriented approach will facilitate a different level of customer experience, competitiveness, advanced security, and operational efficiency. For example, an electronics company invested most of its marketing budget in conventional channels, including paper, television and the display. However, when analyzing the consumer decision process, it was observed that most of the clients were browsing the websites of the retailers and less than 9% visited the brand’s website. It was enough for the company to go from conventional advertising to show content from the websites of its distributors so that the sales of its e-commerce, increased 21%.

2.Cross-sectional (entire company) Analytics

Analytics should not exist only in departments such as marketing or risk management, it should be present throughout the company. Data analytics will be used to understand business dynamics and reveal ways to increase efficiency. The insights generated from different departments will be integrated in order to obtain an enterprise level strategy and thus eliminate redundant processes to increase efficiency, growth and productivity.

3. Applications in cyber security:

We have reached a level of digital technological dependence of such magnitude that cyber attacks have also become much more unbridled. Apart from attacking global financial institutions, cyber criminals are also targeting personal data and devices and more cases of ransomware have been recorded worldwide. Cybersecurity is one of the biggest concerns in the industry – continued protection is only possible through big data analytics – it will become an important investment area and grow rapidly. Businesses and government agencies will update their security systems to the next generation of software that deals with ultramodern security threats. According to Cybersecurity Ventures’ Cybersecurity Market Report, cybersecurity spending will exceed one trillion dollars from 2017 to 2021.

4. IoT & IoP:

There will be a transition from the “Internet of Things” to the “Internet of People”. The productive analysis on human behavior, interactions and other cognitive areas will grow and begin to filter all vertical sectors of the industry. For example, hospitals will increasingly use machine learning techniques to predict the likelihood of a disease relapse. This will allow them to prepare the readmission of a patient precisely at the time of initial discharge.

5. Reduce the talent gap:

It is obvious that the talent gap in data analytics will skyrocket as demand expands. It is hoped that organizations and academic institutions collaborate to generate skills and talent that meet the demand of data engineers. McKinsey estimates that the shortage of personnel in 2017 is about 200,000 for the United States alone, this figure can easily double worldwide. In March 2016, Continuum Analytics (creator of the Anaconda open source analytics platform) launched the Anaconda Skills Accelerator Program (ASAP), a 12-month data science course. According to the industry’s estimate, data scientists receive as much as twice the compensation received by a programmer.

6. Collaboration between scientific companies:

Companies will have to learn and deploy traditional and scientific techniques of pattern matching and artificial intelligence for analytical use cases. For example, techniques for analyzing gene sequences in DNA are used in text-matching algorithms to process mass emails. It is expected to see close collaboration between data scientists and the scientific community, especially from disciplines such as neuro-science, molecular biology, astrophysics, particle physics and organic chemistry. For example, image processing is widely used in “tagging” on social networks, while speech recognition is used in applications such as Siri.

7. Technology:

Companies will move from local platforms to cloud and hybrid environments. According to an IDG survey, 44% of apps used by Fortune 500 organizations are already in the cloud, and by the end of 2017, more than 50% of IT applications will move to the cloud as well. This leads to an increase in the demand for agile analysis tools that are simple, flexible and capable of handling various data sources. Hadoop will continue to be increasingly popular, as it allows us to store an extremely large volume of data at a significantly lower price. The proportion of unstructured data in the data warehouse will continue to increase. Hadoop, now, has passed the evaluation phase of business relevance and scalability and its adoption is expected to accelerate sharply. According to a survey of 2,100 CXOs, entrepreneurs and IT executives from 1,300 companies around the world, 49% of respondents agreed that they obtained tangible value through Hadoop. In addition, 45% of the rest was anticipating a considerable benefit in a short period of time. We are moving towards a new era in the domain of analysis. Thanks to big data, pioneering ideas and innovative technologies are emerging in the vertical sectors of the industry, although this is made up of highly disaggregated data. New markets are opening up for the world of analytics, and if these markets want to be an example of innovation and growth, they will have no choice but to take advantage of big data to make 2018 a successful year.